The audit log
Every tool call that passes through Harriet is recorded: who called what, with which skill, from which connector, and whether it worked. Open it from Manage → Audit log in the Provisioner console.
What Harriet records
The log covers gateway and in-app tool traffic. Entries come from two sources: the MCP Proxy (tool calls made from desktops through Harriet's gateway) and the Chatbot (tool calls Harriet makes in-app, from web chat, Slack, and other channels). The methods you will see:
| Method | What it is |
|---|---|
initialize | A desktop opening its connection to a gateway connector. Hidden from the default list. |
tools/list | A desktop asking a connector which tools it offers. Only failed calls are recorded; successful ones are not logged. |
tools/call | An actual tool invocation through the gateway. For these rows the Method column shows the tool's own name. |
tool_invoke | An in-app tool call from the Chatbot source. |
The log is append-only: entries are written as calls happen and are never edited.
Reading the log
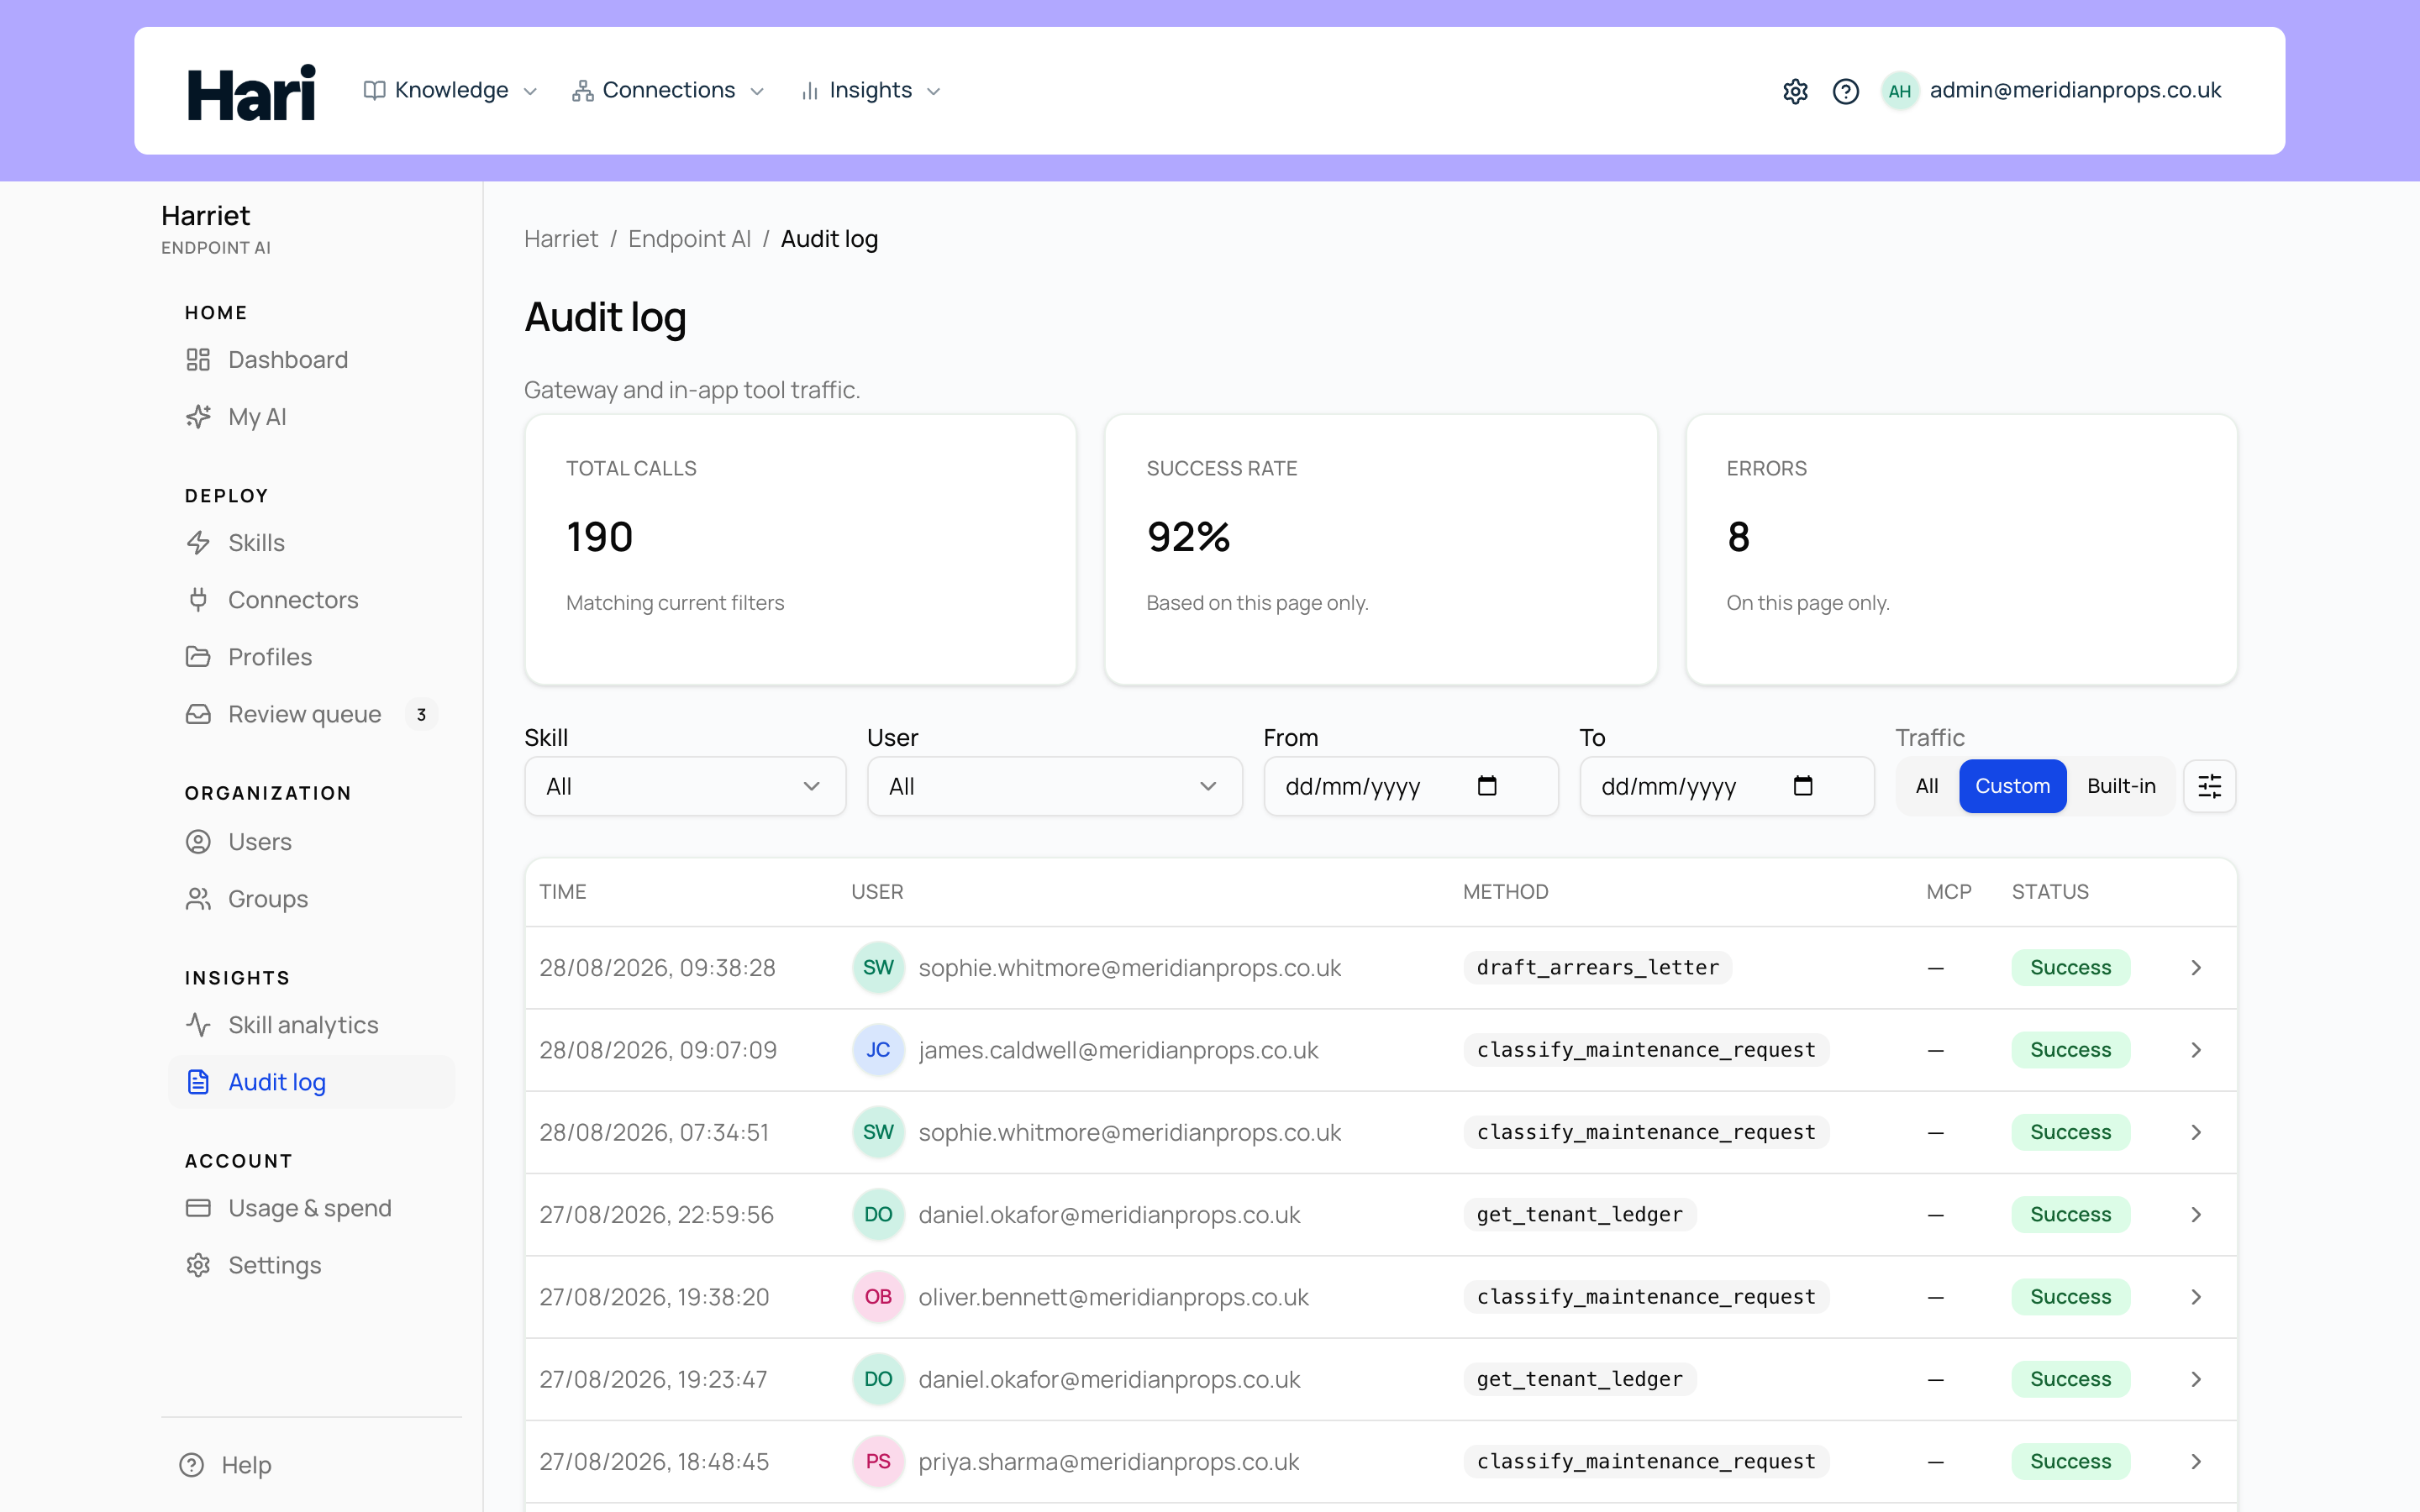
Three summary cards sit above the table (Total calls, Success rate, and Errors), computed over the current filters. The table columns are Time, User, Method, MCP (the connector, shown by its display name), and Status (success or error).
You can filter by Skill, Connector (type a connector name), User (type a name or email), and a date range (From / To). The Traffic toggle switches between all, custom MCP, or built-in Harriet traffic: All ("All traffic (MCP proxy and in-app)"), Custom ("External MCP traffic (desktop proxy only)"), the default, and Built-in ("In-app Harriet tool calls (web, Slack, etc.)"). Behind the filter icon, a Show hidden switch reveals "initialize, tools/list, and other rows omitted from the default list" when you need the full protocol trace.
The detail view
Selecting a row opens an Audit entry dialog with the same fields plus, for failed calls, the error detail, including the upstream HTTP status when a connector's own service failed, so you can tell a broken connector from a gateway problem. A Copy link button copies a direct URL to that entry; opening the row also updates your address bar, so any entry can be deep-linked into an incident ticket or a Slack thread.
When argument and result storage is on (below), the dialog also shows Arguments and Result, visible only to people who hold both audit access and the "View provisioner tool debug data" permission. Everyone else with audit access sees the call metadata and failed-call error messages.
The Tool call detail setting
By default, Harriet records that a call happened, not its payload. In Manage → Settings, under MCP audit logs → Tool call detail, the switch Store tool arguments and results turns payload capture on for support and debugging. Only account owners can change it (other admins see the setting read-only) because it decides whether potentially sensitive request content is retained at all.
Audit detail is plan-gated: "Tool-level MCP audit requires Endpoint AI Team or higher." On lower plans the console shows that message with an upgrade link instead of rows. See Plans.
Retention
No retention limit is applied by default. If your organization sets a log retention period in Harriet's company settings (minimum 7 days), a nightly job applies the same window to the audit log: entries older than the window disappear from the console. Not every call stores a payload even when capture is on; for example, some successful list operations are not retained.
What to use it for
- Incident review. Filter by user and date range to reconstruct exactly which tools were called around an event, then deep-link the relevant entries into your writeup.
- Verifying a rollout. A device's first gateway call appearing here is the proof that provisioning worked end to end — it is literally a step in the onboarding checklist.
- Spotting failing connectors. Watch the Errors card and filter to error status; the detail view's upstream error information tells you whether to fix the connector's credentials or its service. See Connection errors.
For usage volumes and spend rather than individual calls, use Analytics.