Usage analytics
The LLM Usage screen shows who is spending what, on which models, in near real time. It covers every call routed through the LLM proxy — both BYOK and managed traffic.
The LLM Usage screen
Open LLM usage from the console (the Billing tab's Open LLM usage button lands here too). It has two tabs, Usage analytics and Budgets; this page covers the first, and Budgets covers the second. Viewing usage analytics requires the provisioner audit permission.
Four tiles summarize the current calendar month:
- Spend (this month): total cost of proxied LLM calls so far.
- Tokens (this month): input plus output tokens.
- Burn rate ($/day): average daily spend this month.
- Projected month-end: the burn rate extended to the end of the month.
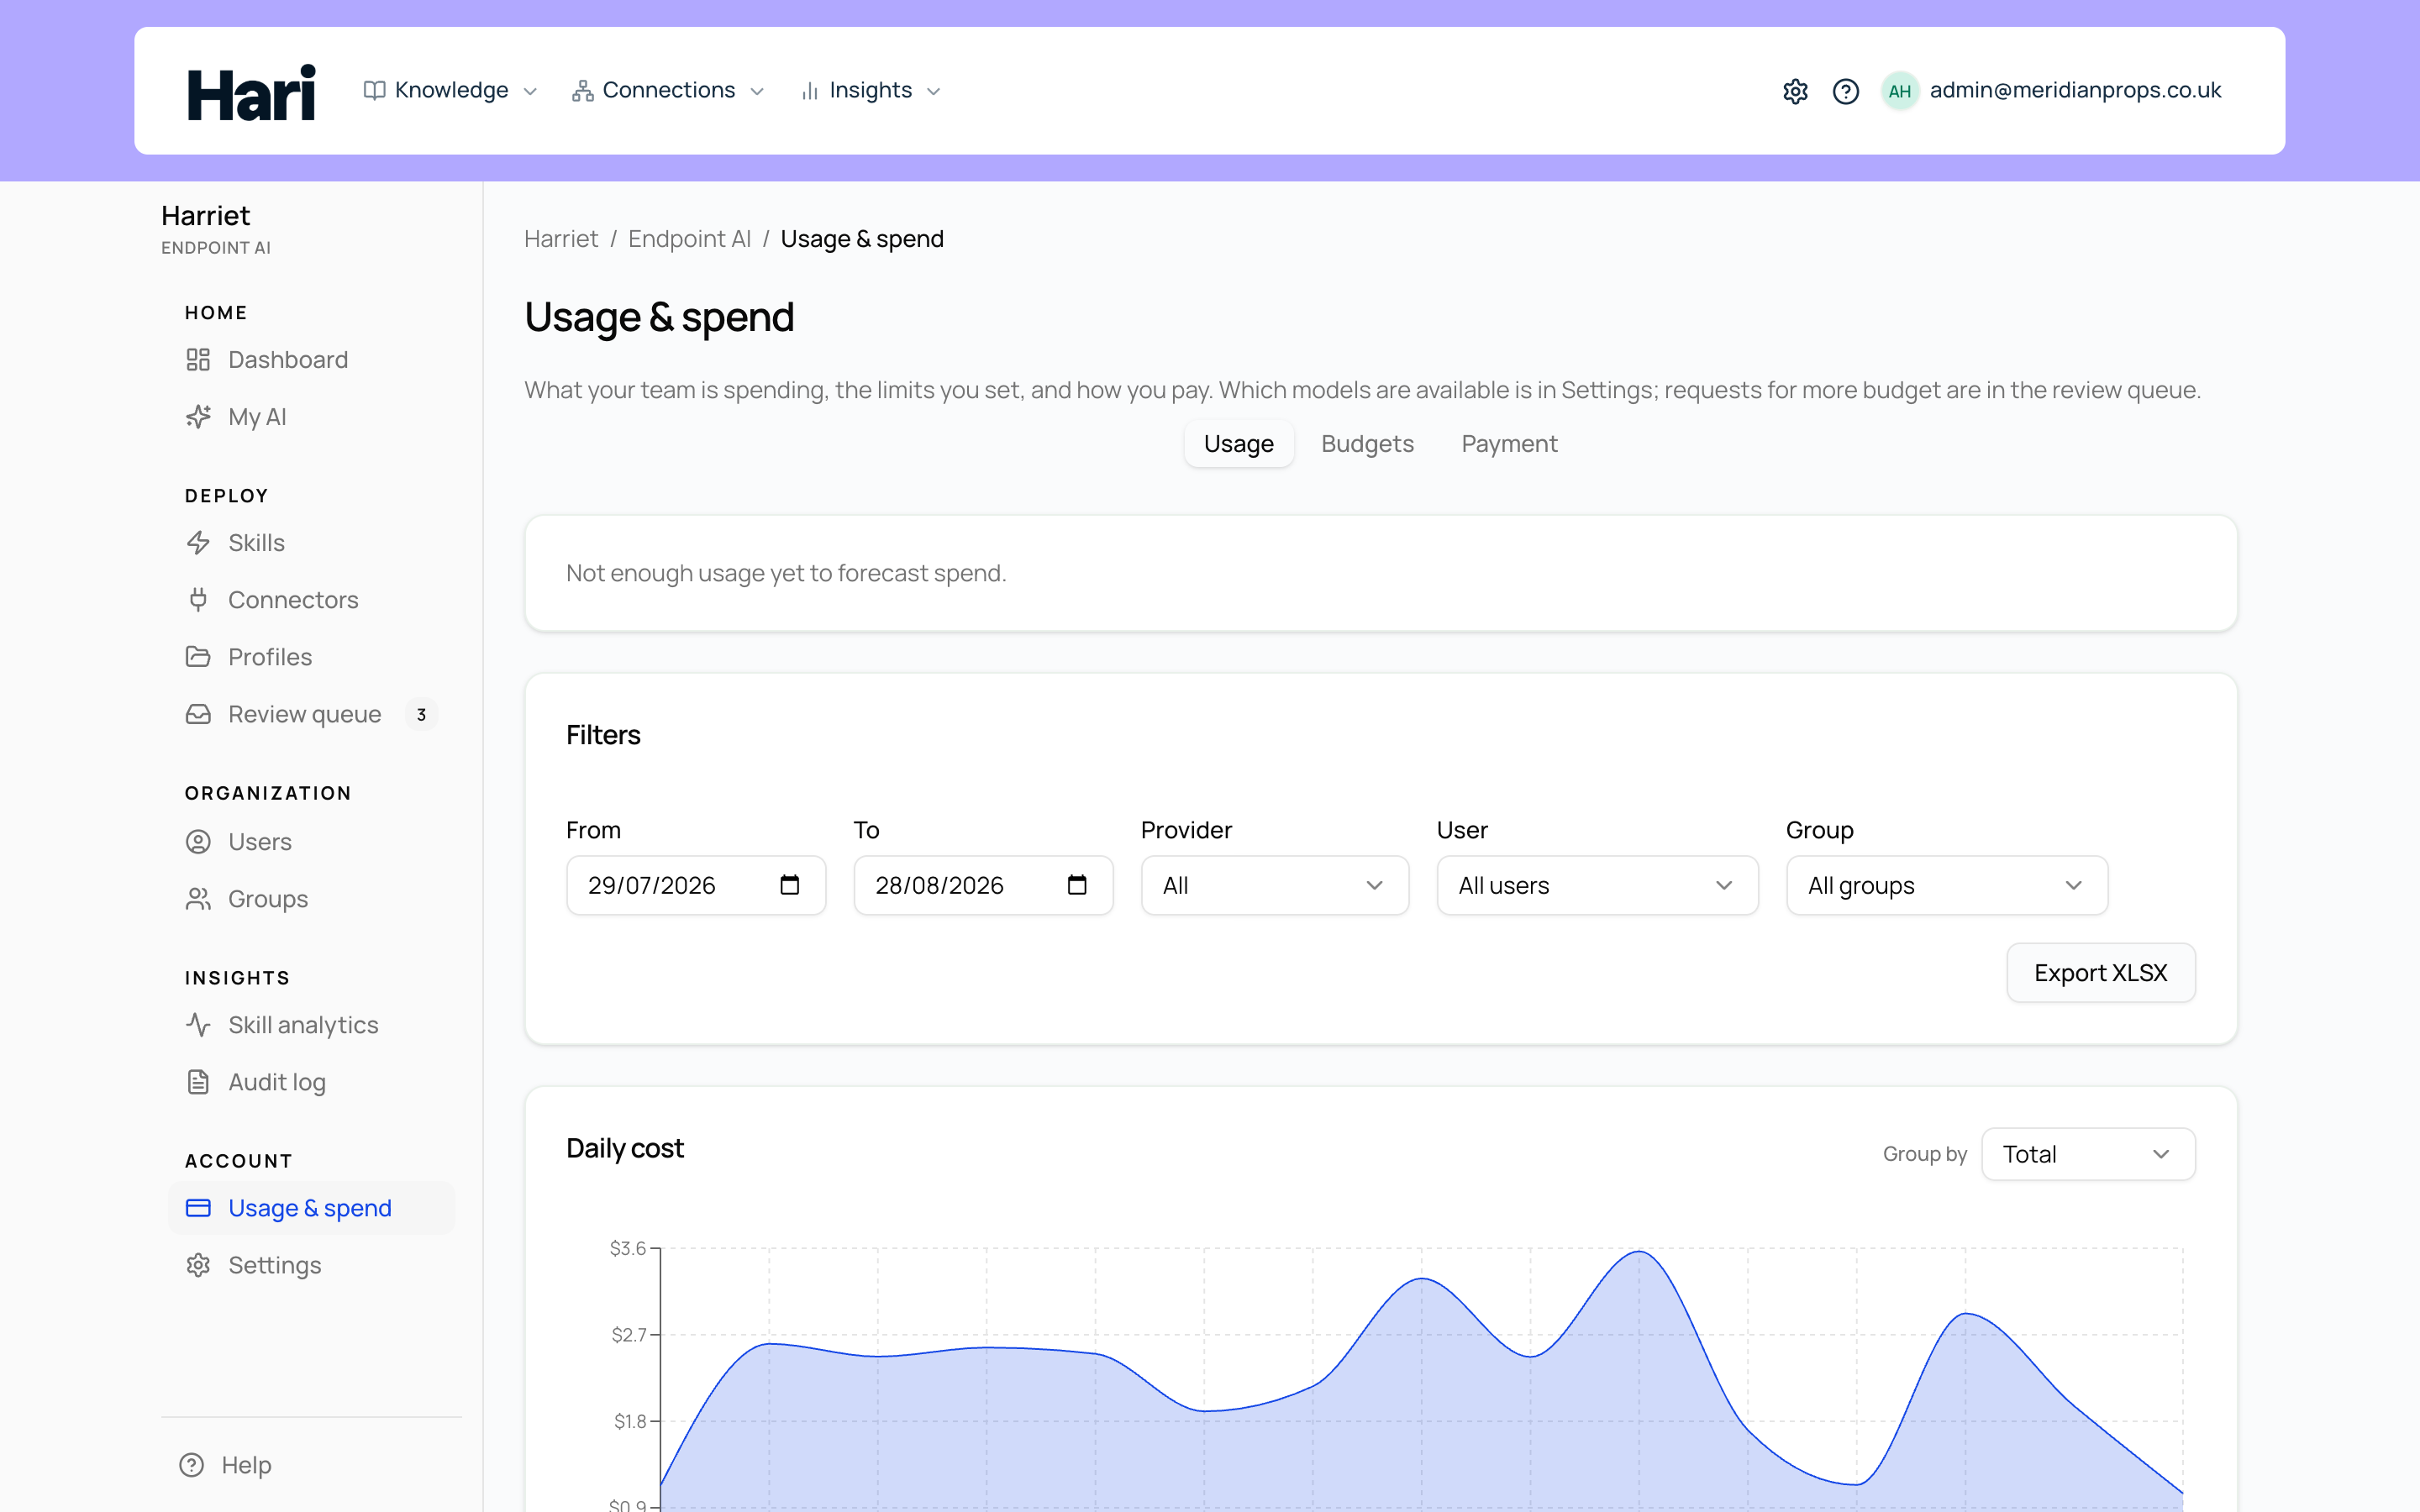
Below the tiles, the Daily cost chart plots cost per day for the selected range.
Breakdowns and filters
Three cards rank spend for the selected range: Top users, Top models, and Top teams, each with a cost bar per row. The Leaderboard (this month) table below them lists the top people for the calendar month with their Spend and Requests counts.
The Filters card narrows everything on the tab: a From and To date range, a Provider select (All, OpenAI, Anthropic), and User and Team selects. Choose your filters and select Apply. Use the user filter to answer "what did this person spend last week", or the team filter to compare a pilot team against the rest of the organization.
Investigate Desktop efficiency
Open Skill Analytics (it opens on Activity) and switch to the Efficiency tab with the surface filter on All surfaces or Harriet Desktop. Choose the last 7, 30, or 90 days, then slice by team, person, skill, or Sessions using model. Team and person filters apply together: pick a team to narrow the people list, then a person inside that team.
The briefing leads with unduplicated Desktop spend, where it concentrates by model and person, and how that spend changed versus the previous period. Below that, a heatmap places skills on the left and the five highest-spend Models, People, or Teams across the top, plus an Other column for the tail. Colour marks the expensive intersections. A line above the grid says what those five columns actually add up to, so a long tail is not mistaken for the whole bill. The grid shows the highest-spend skills first and folds the rest into Other skills. Open a cell to see session workpapers for that skill and that model, person, or team. Use Prepare a model trial for a short brief; it does not change routing. A skill shows a one-line saving hint only when Harriet has enough complete sessions to treat a cheaper same-family model as ready to evaluate.
Spend in sessions overlaps. If a $10 session uses two skills, each skill shows $10. Do not add the rows together. The Desktop spend figure counts each call once. Model and person columns count each dollar once; team columns can exceed Desktop spend when someone belongs to more than one team. A modeled saving is a price comparison for the same tokens, not proof that a cheaper model would have done the work well. Harriet waits for enough complete sessions before treating a candidate as ready to evaluate.
Costs are estimates in USD for Harriet Desktop calls through Harriet’s gateway, including calls made with customer API keys and work delegated to sub-agents. Direct model connections, customer charges, and tax are not included. Eval sessions are included because they also incur model spend.
Reporting incomplete means some skill information has not arrived or is no longer available under your retention settings. Fully reported sessions with no observed skills are shown separately. Older costs without session or source information cannot be reliably linked retrospectively; the coverage notes show those gaps. Use an updated Desktop release to start collecting the new session links.
Tool traffic on the Dashboard
LLM spend is only half the picture; the other half is what skills actually did with their tools. The Dashboard carries that side:
- Tool call activity: MCP proxy successes and errors by day, across all devices.
- Call status: the share of successful proxy calls.
- Recent activity: a live tool call stream showing the latest MCP calls, with View all linking into the audit log.
What employees see
People don't need admin access to know their own numbers. The My AI page shows each person Your LLM usage (via Harriet proxy) with their own cost and token totals — the same figures that appear in your LLM Usage reports, so there are no surprises in either direction. See Your usage.
Usage analytics is a read-out; it never blocks anything. When a number here worries you, turn it into a budget so the proxy enforces the limit for you.