The dashboard
The Dashboard is the admin's home screen: four numbers that summarize the deployment, quick actions for the next step, and live charts of what devices are actually doing.
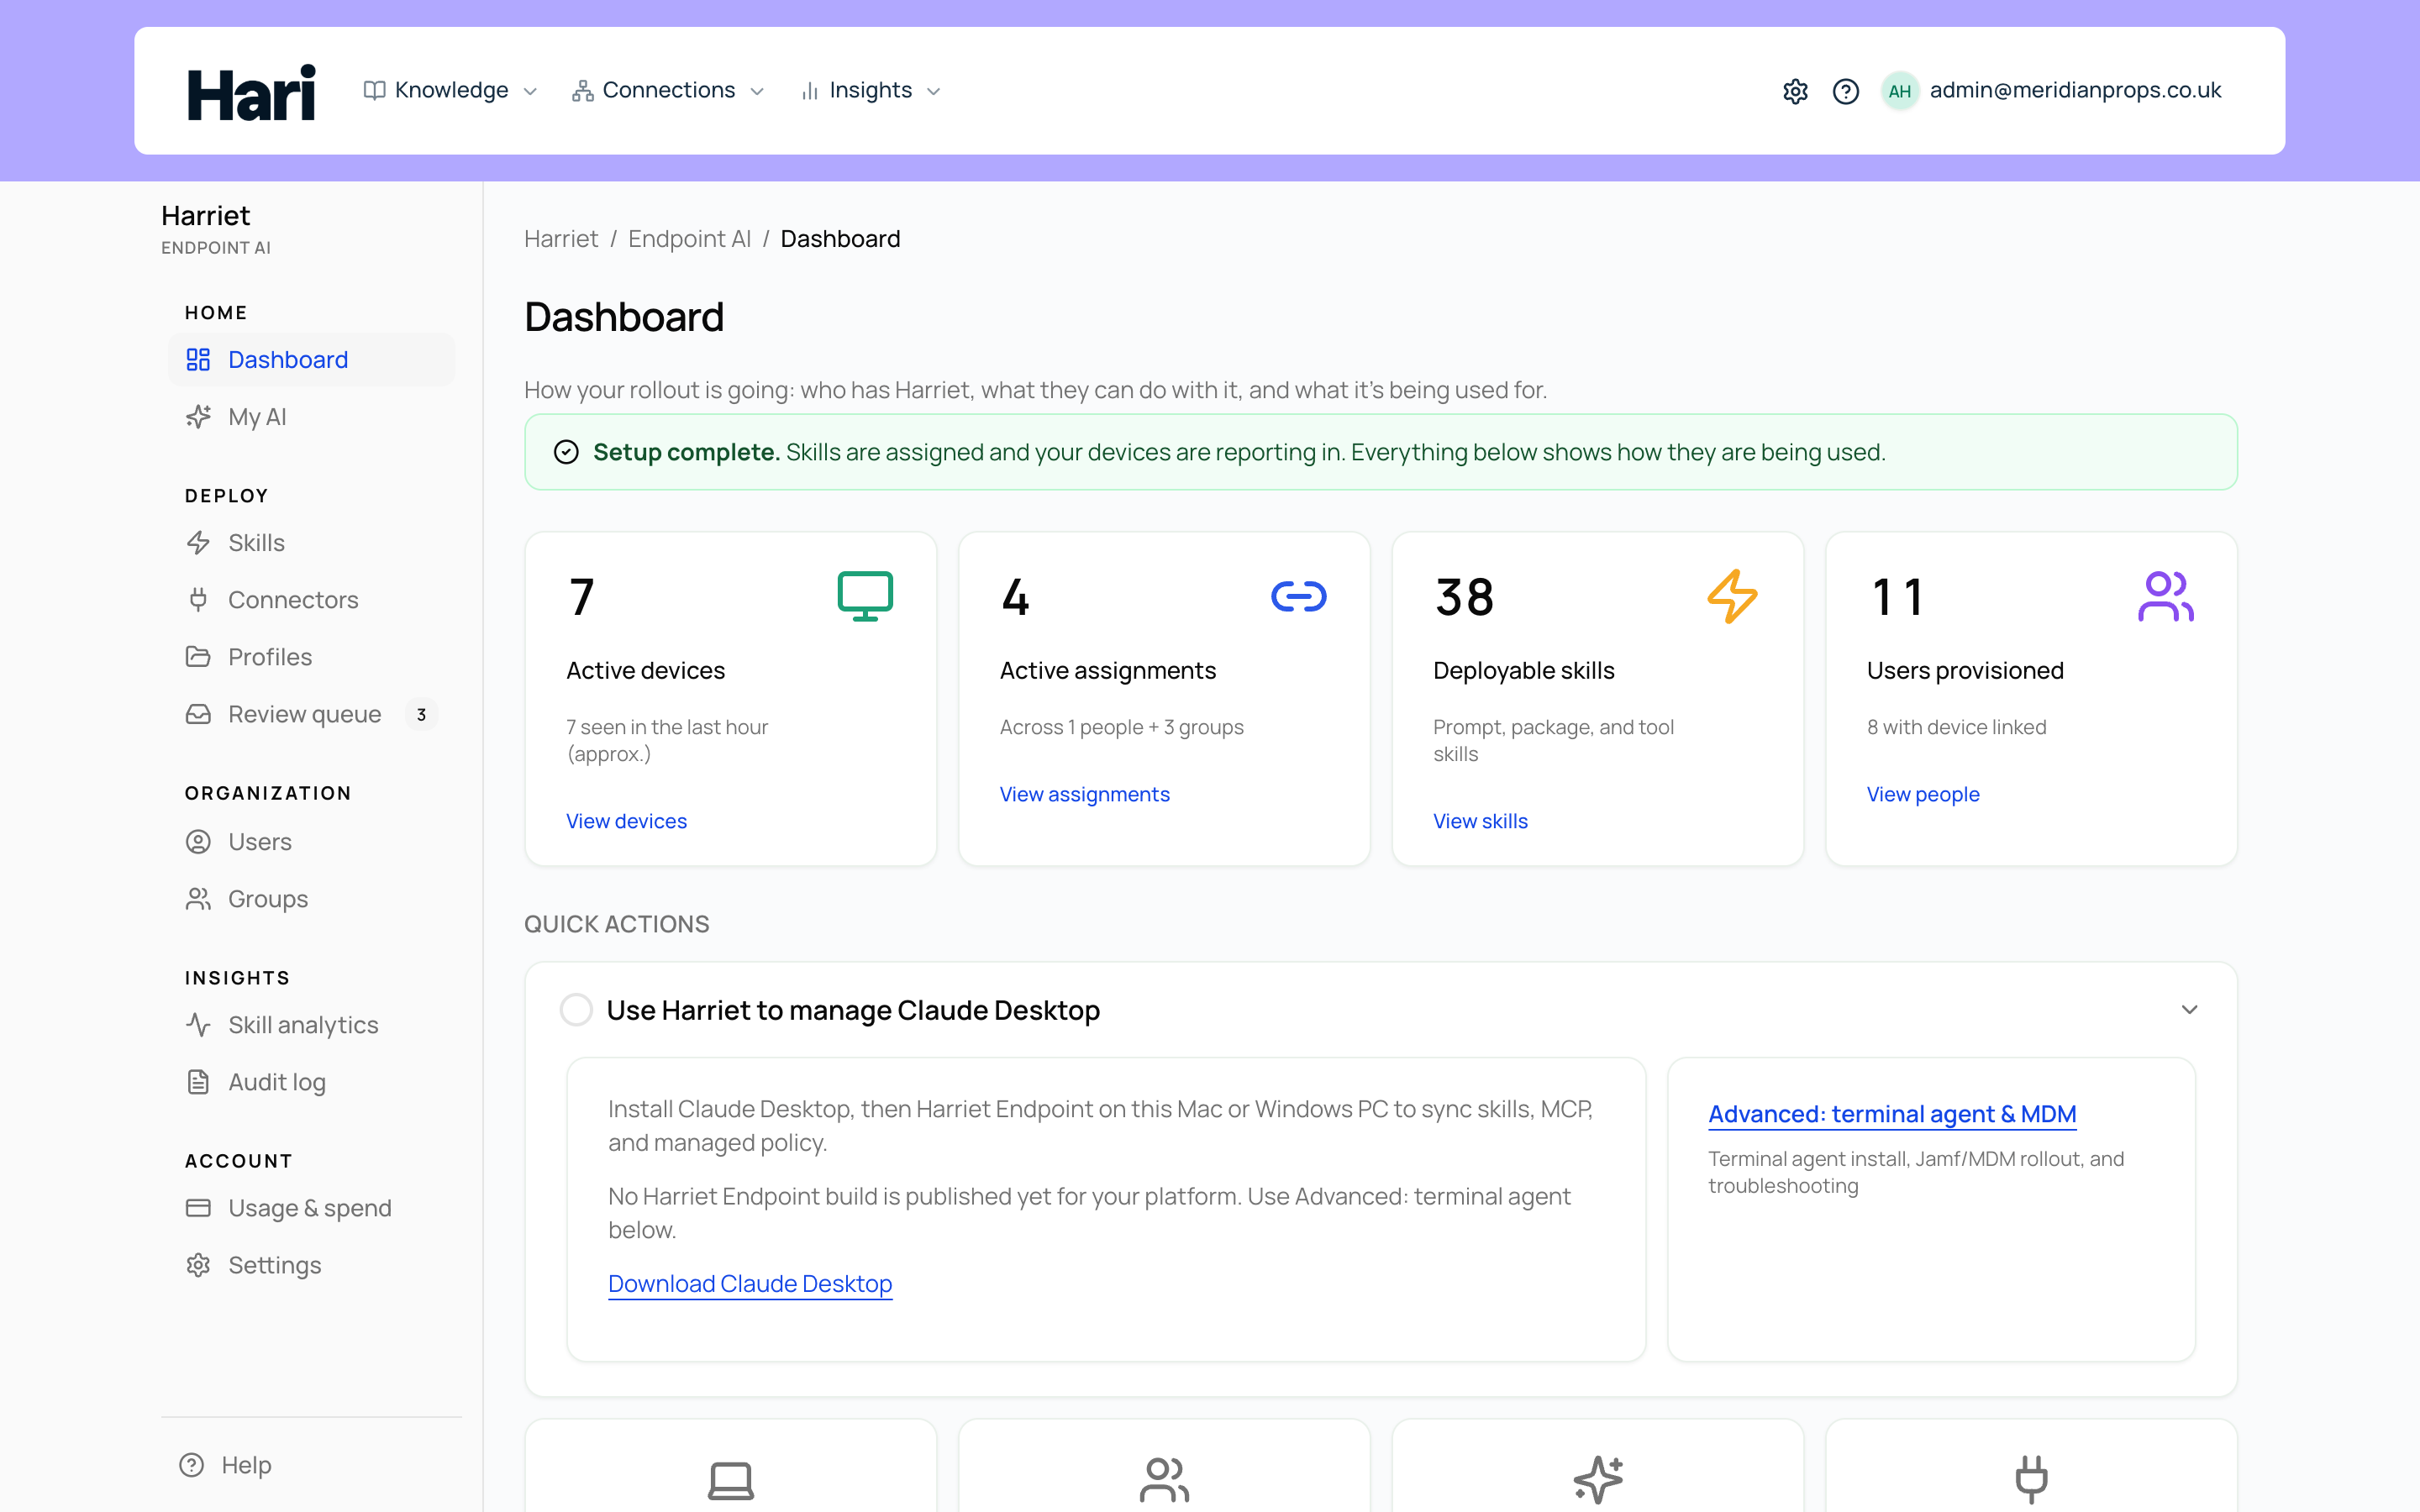
The four KPI tiles
| Tile | What it counts | Detail line |
|---|---|---|
| Active devices | Enrolled devices with status Active | How many were seen in the last hour (approx.), with a View devices link |
| Active assignments | All skill and profile assignments | Split across people and teams, with a View assignments link |
| Deployable skills | Prompt, package, and tool skills the provisioner can deploy | View skills link |
| Users provisioned | People in the organization | How many have a device linked, with a View people link |
Read the tiles together: many users provisioned but few active devices means enrollment invites are going unanswered; many devices but few assignments means machines are enrolled and idle. Each tile links straight to the screen where you fix its number.
Quick actions
Below the tiles, quick action cards cover the common next steps. Which cards appear depends on your Default desktop providers setting: with Harriet Desktop enabled you get an Install Harriet Desktop card with the download for your platform; with Claude Desktop modes enabled you get terminal agent setup links for macOS, Windows, and Linux.
Four smaller cards follow: add the computer you're using now, Roll out to a team ("Deploy Harriet to an entire team in one click"), Skills, and Connectors ("Install integrations from published templates").
The MCP proxy charts
Two charts show what the fleet is doing, both fed by the same audit data as the audit log:
- Tool call activity: "MCP proxy successes and errors by day". Every tool call routed through Harriet's gateway lands here as a success or an error, aggregated across all devices.
- Call status: "Share of successful proxy calls", a donut of the all-time success ratio.
Read them as a pair. A dip in total activity is an adoption signal; a rising error share with steady volume is a health signal, usually one connector with expired auth or changed permissions. A high success share on near-zero volume means nothing is proven yet — volume first, then ratio.
If the charts show "Metrics unavailable (owner access required) or no data yet", your account lacks the View provisioner audit and usage role; see Roles & permissions.
Recent activity: the live tool call stream
The Recent activity card is a live tool call stream: for each recent MCP call, the tool name, the connector or skill it ran under, who ran it, a success or error badge, and when. It is the fastest way to confirm a rollout wave is real — names you recognize, running tools you shipped, mostly green.
To investigate any row further, follow View all → to the full audit log, where you can filter and, with the right role, inspect stored arguments and results. The stream appears only when your role includes audit access and your plan includes tool-level MCP audit (Endpoint AI Team and higher; see plans).
Adoption overview and warnings
The Adoption overview panel turns the rollout into three progress bars: Users with device linked, Users with any assignment, and Teams with profile assigned, each shown as a count and percentage. These are the numbers to report weekly during a rollout; the rollout playbook explains what to do when one lags.
The Dashboard also surfaces problems on its own: a Devices not reporting warning when devices haven't checked in recently, and a Finish setup card while onboarding steps remain open.